


TL; DR
- Awareness → Impressions, total audience, engaged audience, saves.
- Traffic → Outbound clicks + save/engaged audience mix.
- Conversions → Add-to-cart, checkout, purchases (via Tag/Conversions API)
“The best time to plant a tree was 20 years ago. The second-best time is now.”
That proverb sums up Pinterest pretty well.
You know, unlike TikTok or Instagram, where content fades fast, a Pin keeps working in the background. In fact, Pinterest’s data shows a single Pin can reach half their total engagement in about 13 months, give or take.
That longer “half-life” means your content doesn’t just spike and disappear, it continues to generate clicks, saves, and sales long after you publish. And it matters: Pinterest now reaches over 578 million monthly active users, and the platform pulled in $1.15 billion in revenue in Q4 of 2024 alone.
That’s why measuring the right metrics is critical. People don’t come here to follow influencers or scroll endlessly; they come with intent to search, plan, and eventually buy. On Pinterest, followers are nice-to-have, but they’re not your north star. The real signals of success are reach and engagement, how often your content is discovered, saved, and acted on.
Hey! FYI, we’ve already broken down how Pinterest works as a kind of pre-commerce buddy, where inspiration quietly shapes purchase decisions before people even hit checkout.
And if you want a deeper lens into what merchants often overlook, that 93% of Pinners plan to purchase, we also explored how that makes Pinterest very different from Instagram or TikTok.
Starting with those will give you the right foundation, and this post on analytics will layer on top of it more easily.
Here, we’ll stay focused on what comes next: Pinterest Analytics.
Because for merchants, analytics isn’t just a set of numbers. It’s how you see intent playing out, who’s seeing your Pins, who’s saving them for later, who’s clicking through, and who’s buying.
So, how do you actually measure all that intent?
Here’s how,
You should know that measuring success on Pinterest doesn’t look the same as it does on TikTok, Instagram, or Facebook. That’s because Pinterest is built less like a social network and more like a visual search engine.
Here’s how to focus, depending on your goal:
Deciding your goal first
Before you dive into metrics, it’s worth asking: what are you actually trying to achieve on Pinterest right now?
Think of it like building stages: first awareness, then interest, then purchase. Your goal determines which metrics matter most, so you’re not measuring everything at once and drowning in numbers.
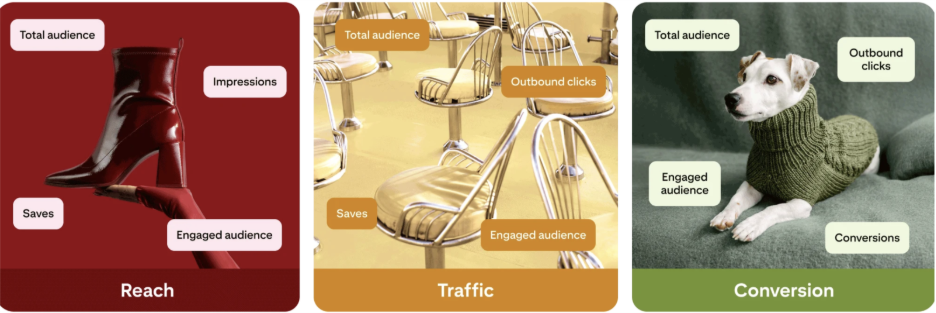
🎯 Goal: Build your audience & brand awareness
🎯 Goal: Drive traffic
Note: Outbound clicks are measured starting from the date the link is added.
Along with saves, total audience, and engaged audience, these help you measure not just reach but the intent to return or act.
🎯 Goal: Conversions
Along with total audience and engaged audience, this shows how your broader reach narrows into actual buyers.
Now, of course, every merchant dreams of conversions being the end goal, but it rarely happens overnight. It takes time to build the right creativity, consistency, and audience trust before clicks reliably turn into carts. Think of it as planting seeds: the fruit of patience is sweet, and on Pinterest, it’s worth the wait.
The potential is massive: with 85% of weekly Pinners saying they’ve made a purchase from a Pin, the platform isn’t just about discovery, it’s a proven driver of sales. Along with total audience and engaged audience, these metrics show how your broader reach gradually narrows into actual buyers.
Supporting metrics to interpret performance
Note: Outbound clicks are measured starting from the date the link is added.
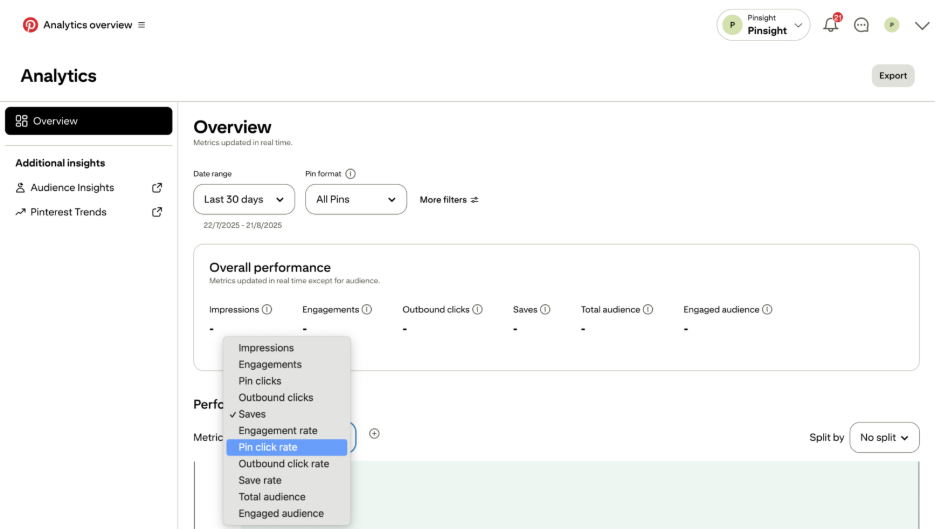
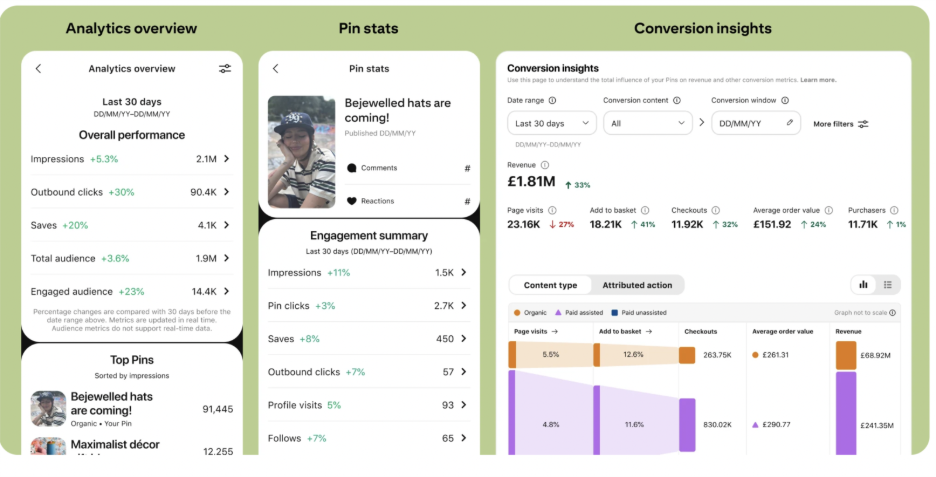
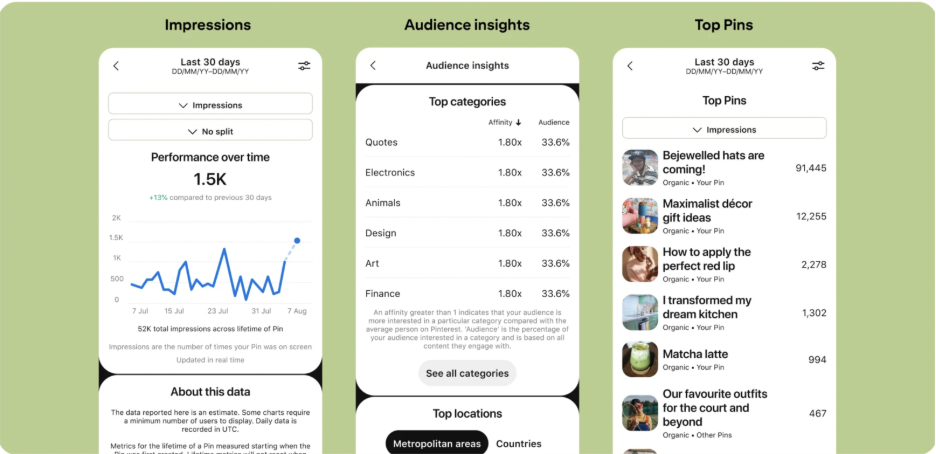
The main dashboard for business accounts. It shows overall performance trends, top boards, top Pins, and audience insights.
How to access: On desktop, open the menu in the top-left corner and select “Analytics overview” under the Analyse performance section. On the mobile, go to the Creator Hub on your profile page, then tap Analytics.
Take a closer look at how people interact with a single Pin. This dashboard shows impressions, saves, Pin clicks, profile visits, follows, and outbound clicks. To access: log in to your business account → go to your profile page → tap Created → click on a Pin → select Pin stats.
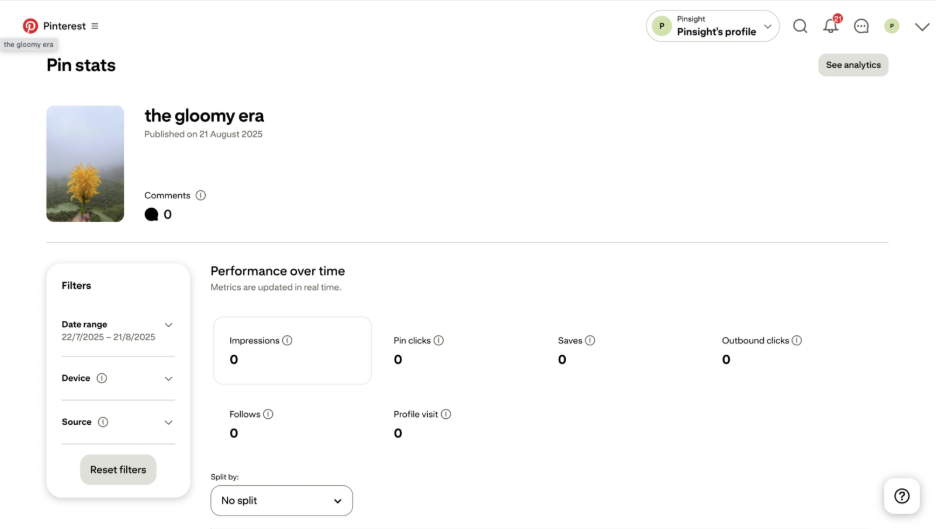
For video Pins, you’ll also see video views, watch time, and average watch time.
Here are the video pin metrics to measure:
A tool that helps you measure the total influence of your Pins on revenue and other conversion metrics. This feature is only available if you set up tracking with the Pinterest Tag and/or Conversions API.
You can find it on desktop by opening the menu in the top-left corner of your screen and selecting Conversion Insights under the Analyse performance section.
You should know that your Pinterest Analytics doesn’t just track the Pins you create yourself. They also include how people engage with other versions of your content across the platform.
This distinction matters. When you claim your site, you capture credit for all the “off-Pinterest” activity, like when a shopper saves a product image directly from your store.
Your data isn’t just numbers; it’s a story about how people are discovering and engaging with your brand. The more you read it, the more you can fine-tune your messaging, creativity, and timing.
👉 These supporting metrics act like a feedback loop. They don’t just tell you what happened; they show you where to double down, where to pivot, and how to stay ahead of audience behavior.
Finally,
Pinterest Analytics isn’t just a dashboard of numbers, it’s a window into how people plan, save, and shop around your products. From impressions that signal discovery, to saves that hint at future intent, to clicks that show purchase readiness, every metric tells a piece of the story.
When you track these signals together, you start to see patterns: what content draws attention, what drives action, and what keeps your brand in the conversation long after a Pin is published.
Think of it less as checking stats and more as learning the rhythm of your audience. The better you understand that rhythm, the more confidently you can plan content that meets shoppers where they are, and where they’re headed.
👉 And hey, if you’re already running an extended warranty program, or planning to add one, don’t forget that warranty metrics matter too. Attach rates, AOV lifts, and retention signals can be just as revealing as clicks and saves.
Track them alongside your marketing metrics as interconnected metrics, and you’ll see the bigger picture of how customers move from interest to loyalty.

.jpg)