


Remember Andrew Garfield as Eduardo Saverin, the early co-founder of Facebook in the movie The Social Network? He thought owning 30% would give him power, until he realized he never had the leverage to shape what Facebook became.
If you’re a merchant tracking metrics the same way as you are doing now, you might just be Eduardo. You’ve got extended warranties in place. You’re tracking extended metrics, claim rates, attachment rates. And of course, the classics: AOV (average order value), conversions, bounce rates. But you’re tracking them separately. Just like you did in 2018. Retail metrics in one tab. Warranty metrics in another.
It feels like you’re in control, just like Eduardo felt. So, let’s stop using 2025 tools with 2018 thinking.
If you want to level up your business and stop playing catch-up, you have to go beyond just tracking retail and warranty metrics independently. You need to track how they merge, how they influence each other, and what story that tells about your customer journey.
So, what if we did something different?
What if we track the best of both worlds, metrics that blend product performance and customer behavior? I know, I know... more numbers. But hey, “if you can't measure it, you can't improve it”, right? Because what got you here won’t get you there.
🔑 Key takeaways:
Let’s be real; when warranties enter the picture, the instinct is to track them like a separate planet. And first, that makes sense. Claim rates, attachment rates, warranty costs... they feel like they are their own category.
But what gets missed in that approach is the ripple effect. Warranties change how customers think about risk, value, and trust. They don’t just protect products; they shape the purchase itself and everything that comes after.
Extended warranties aren’t just a nice-to-have add-on. And while thousands of SMEs now offer them, most are still measuring them the wrong way.
So… what should you measure?
Glad you asked. What you need is one clean view, a blended dashboard that shows how extended warranties and other business metrics when combined really pull their weight: boosting revenue, lifting conversions, keeping customers happy, and fattening up your margins.
Your store needs interconnected metrics, not just isolated numbers that look good on a dashboard because when used right they set off a chain reaction:
What it measures: The total projected value of a customer, including both product purchases and warranty revenue, minus warranty costs.
How to calculate:

This is how it looks in action:
Let’s say this is your store:
So:
$100 × 3 × 2 = $600
That’s their lifetime value without any warranty. Cool so far?
Now you offer warranties:
So, you’re not getting the full $30, because you’re spending $10 on service.
You’re left with $20 profit per warranty
But only 40% of customers buy warranties. So:
That means on average, each customer (including the ones who don’t buy warranties) is now worth $8 more than before.
But only 40% of customers buy warranties. So:
That means on average, each customer (including the ones who don’t buy warranties) is now worth $8 more than before.
So that’s where the extra $8 comes from, warranty revenue after costs, averaged across all your customers.
Why it matters:
Extended warranties aren’t just extra revenue; they change how valuable a customer is. Studies show customers who buy warranties tend to have 2–3x higher lifetime value, even after factoring in claim costs. A 2024 retail study found that warranty buyers increased CLV/CLTV by 15–20% for high-value products like electronics.
Warranty customers tend to be more satisfied and come back more often, making extended warranties less of a nice-to-have and more of a quiet driver of long-term growth.
What it measures: How warranty availability affects overall purchase conversion, not just warranty attachment.
How to calculate:

What each term means:
Baseline conversion rate: This is your normal conversion rate without offering any warranty options.
Conversion rate with warranty option: This is the conversion rate when you do offer a warranty option alongside the product.
This is how it looks in action:
Say you’re selling smartwatches.
Step 1: Subtract the baseline from the new conversion rate: 3.0% − 2.5% = 0.5%
Step 2: Divide that difference by the baseline conversion rate: 0.5% ÷ 2.5% = 0.2
Step 3: Multiply by 100 to turn it into a percentage: 0.2 × 100 = 20%
Why it matters:
Warranties don’t just increase revenue; they ease purchase anxiety and lift conversions across the board. Even from customers who don’t end up buying one. Sneaky perk? Yep. Easy to miss? Totally.
What it measures: The total revenue impact per website visitor when warranties are available.
How to calculate:

This is how it looks in action:
Imagine your laptop accessories store, you’ve added extended warranties to your product lineup, things like keyboard covers, portable monitors, and USB-C hubs.
Your data looks like this:
Step 1: Calculate RPV in both cases
Step 2: Find the difference
That $1.50 might sound small—but across 8,000 visitors, that’s an extra $12,000 in revenue
Why it matters:
This captures the full revenue impact of warranties, including both direct warranty sales and the conversion uplift effect.
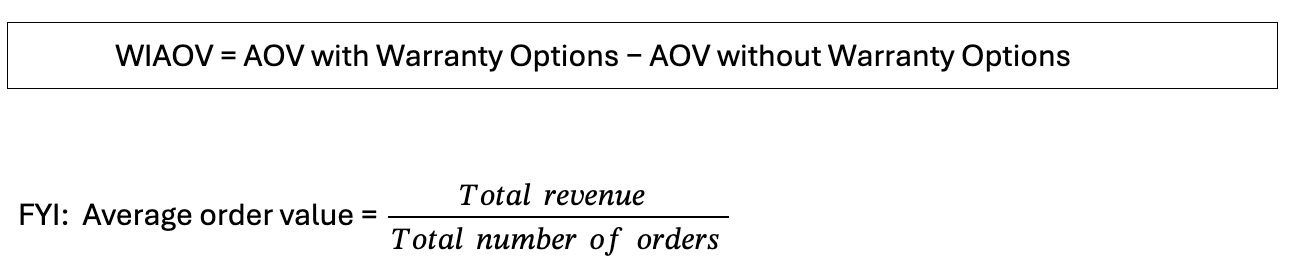
What it measures: WIAOV shows how warranties influence the average size of a customer’s order, including any changes in the mix or value of products purchased. It looks at whether customers with warranty options tend to spend more per order versus those without.
How to calculate:
This is how it looks in action:
Let’s say you sell things like blenders, air fryers, and espresso machines. You’ve recently started offering extended warranties at checkout.
Your data looks like this:
Step 1: Calculate AOV for both groups
Step 2: Apply the WIAOV formula
WIAOV = $90 − $75 = $15
On average, customers who had warranty options spent $15 more per order.
Why it matters: Customers buying warranties often purchase higher-value items or additional products, creating a compounding effect.
Pro tip: If WIAOV is significantly higher, consider promoting warranties earlier in the customer's journey.
👀 Still with me? If you’re feeling lost in the data fog or want help applying this to your store, we’ve got you.
Reach out to the SureBright team anytime, we’re here to make these numbers make sense.
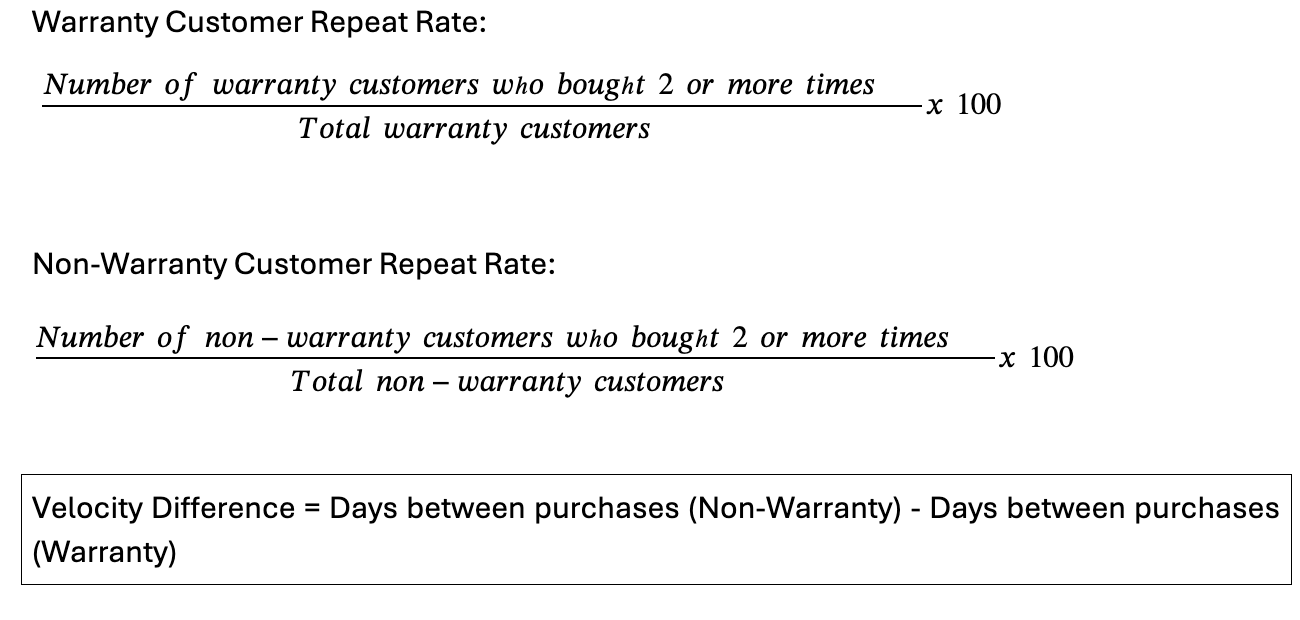
What it measures: How warranties affect the time between purchases and repeat purchase rates.
How to calculate:
This is how it looks in action:
Let’s say you run a home tech store that sells smart gadgets, doorbells, cameras, thermostats.
You've introduced extended warranties, and now you're curious:
Do those customers come back more often than others?
Here’s your data:
Warranty Customers
Repeat Rate = (80 ÷ 200) × 100 = 40%
Non-Warranty Customers
Repeat Rate = (60 ÷ 300) × 100 = 20%
So now we can say:
Warranty buyers repeat at twice the rate.
Let’s look at how quickly they return too:
Velocity Difference = 100 – 70 = 30 days sooner
Why it matters: Warranty customers often feel more confident in making future purchases and may buy more frequently. Extended‑warranty buyers don’t just convert once they come back. In According to this consumer study they were twice as likely to recommend the retailer and buy again.
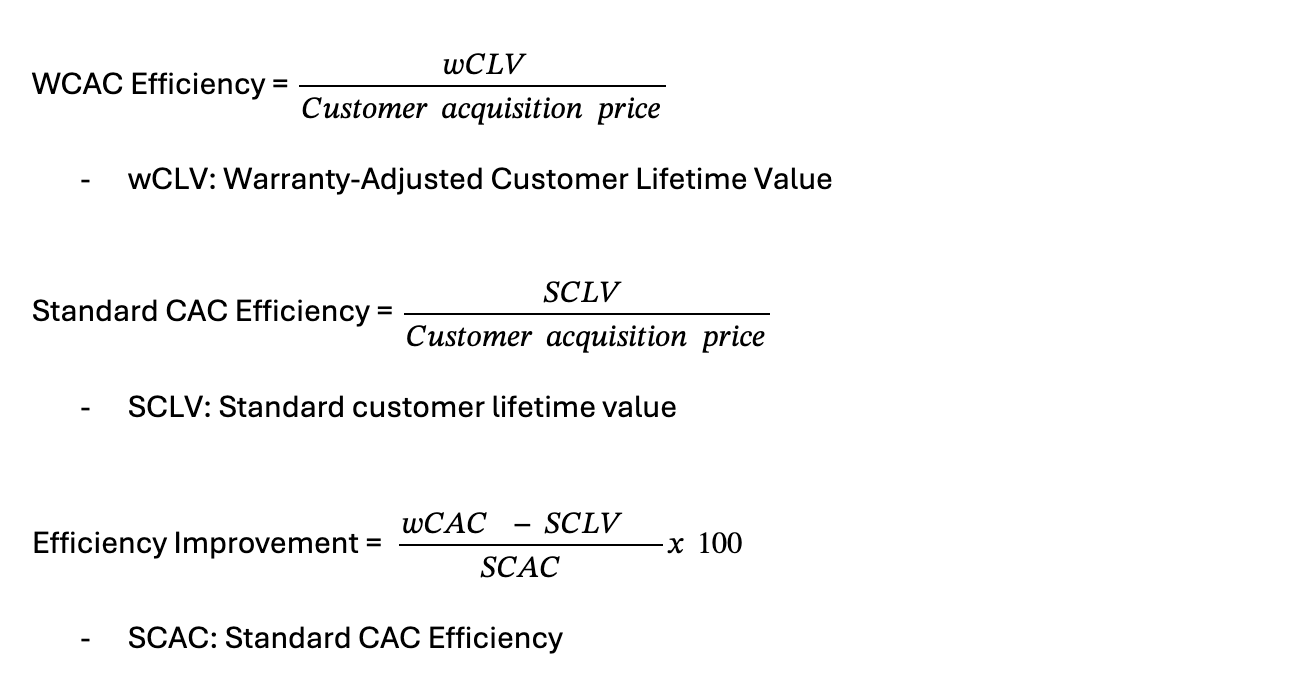
What it measures: How warranties improve the return on marketing spend by increasing customer value.
How to calculate:
This is how it looks in action:
Say you run a furniture store, selling dining tables, sofas, and beds online. You spend around $80 to acquire each customer through ads and promotions. That’s your Customer Acquisition Cost (CAC).
Now let’s look at what each customer is worth:
Let’s plug it in:
Standard CAC Efficiency = $500 ÷ $80 = 6.25
Warranty CAC Efficiency = $620 ÷ $80 = 7.75
So, with warranties, every $1 you spend brings in $7.75 instead of $6.25.
Efficiency Improvement: ((7.75 - 6.25) ÷ 6.25) × 100 = 24% improvement
Why it matters: Higher customer lifetime value from warranties means you can afford to spend more on acquisition, expanding your marketing reach.
Target: Aim for 20-50% CAC efficiency improvement.
What it measures:T he net profit impact of warranty programs after factoring in all related costs, showing if warranties truly contribute to overall profitability.
How to calculate:
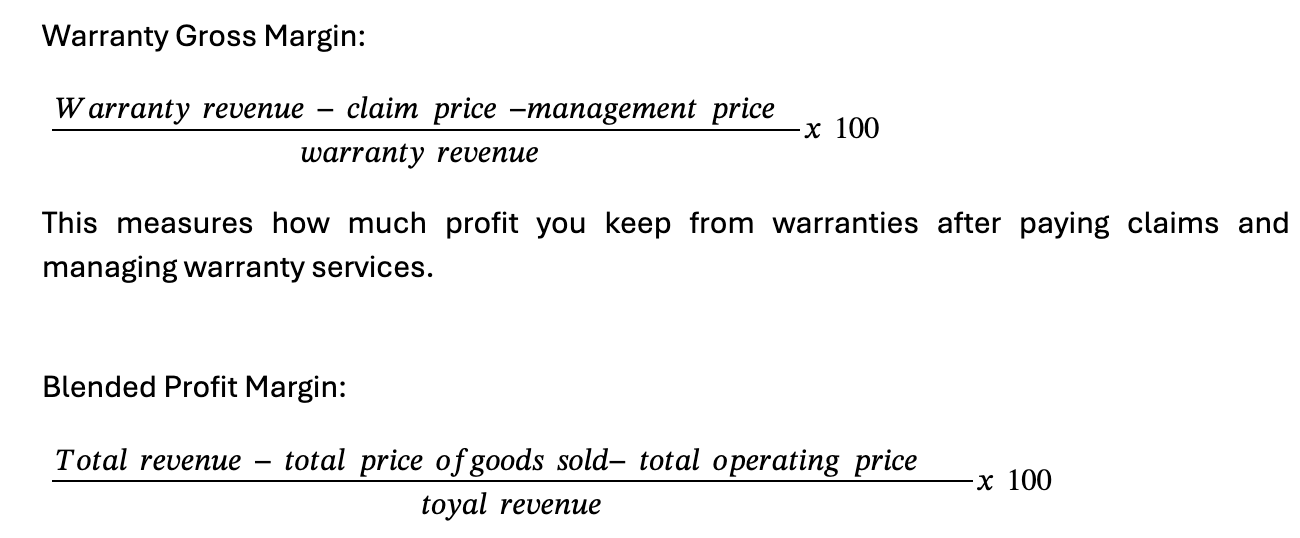
This is the overall profit margin including product sales and warranties, after all direct and operating expenses.
This is how it looks in action:
First: Warranty Gross Margin
Say in one month:
So…
Warranty Gross Margin = (3,000 - 600 - 300) ÷ 3,000 × 100 = 2,100 ÷ 3,000 × 100 = 70%
That means you're keeping 70% of your warranty revenue as profit. Not bad, right!
Now: Blended Profit Margin (Product + Warranty)
Let’s include the rest of your business:
Blended Profit Margin
So, after all costs, product, warranty claims, and ops, you’re left with a healthy 20% profit margin.
Why it matters: High warranty attachment rates mean nothing if they don't improve overall profitability.
What it measures: How warranty ownership affects customer satisfaction scores and review ratings.

This is how it looks in action:
For Instance, imagine you run an online store that sells fitness gear:
Think smartwatches, adjustable dumbbells, resistance bands, and premium yoga mats. Recently, you started offering extended warranties on high-value items like rowing machines and treadmills.
Now you want to measure how happy those warranty buyers are compared to others.
Step 1: Collect customer satisfaction scores
Step 2: Use the formula
That’s a 17.5% increase in satisfaction when a warranty is involved.
Why it matters: Warranties should increase customer confidence and satisfaction, leading to better reviews and word-of-mouth marketing. Research confirms that warranty presence can significantly enhance customer satisfaction when properly implemented.
Target: Look for 10-20% higher satisfaction scores among warranty customers.
📩 Still feeling a little stuck or not sure what your numbers are telling you?
Just shoot us a “hey” at hello@surebright.com — we’ll walk you through it, one step at a time.
Finally,
It’s not about chasing the highest attachment rate. It’s about understanding what warranties actually bring to your business.
Because when done right, warranties do more than increase revenue, they shift how customers buy, how often they come back, and how much they trust your brand over time.
That’s why blended metrics matter. They don’t just show you what’s selling, they show you what’s working. So no, warranties aren’t just a post-purchase upsell.
They’re a signal that you’re playing a long game.
Calculate how much money you can earn by offering warranties, based on your actual order volume in 45 seconds.
👉 Check your potential revenue here (it’s free).


.jpg)
.jpg)

.jpg)
