


“Trust arrives on foot but leaves on horseback.”
Between 2023 and 2025, U.S. commerce has been living that proverb. Trust is slow to earn through warranties, shipping guarantees, and seamless returns, but alarmingly quick to lose when fraud or theft enters the system.
The United States extended warranty market was valued at $48.38 billion in 2024 and is projected to reach $116.7 billion by 2033, growing at a CAGR of 9.20% between 2025 and 2033, positioning extended warranty services among the fastest growing consumer service sectors.
Yet this rapid growth exists alongside rising vulnerabilities. According to Appriss Retail and Deloitte, return and claims fraud and abuse accounted for $103 billion in losses in 2024. Porch piracy drove losses of as much as $16 billion in stolen goods the same year.
What looks like routine consumer behavior, such as checking out with a protection plan, sending back an item, or receiving a delivery, masks risks that now scale with the market itself.
These are not small trends on the side. Warranty adoption, warranty fraud, and porch piracy have become the interlocking forces shaping both revenue and risk across U.S. retail. Just as importantly, they do not spread evenly.
Fraud clusters in certain states, porch piracy peaks during holiday surges, and demographic gaps, such as seniors buying fewer warranties but losing more to scams, show how unevenly consumer protection is distributed.
This article unpacks those dynamics in detail: the growth of the extended warranty economy, the evolving cost of fraud, and the geographic and seasonal fault lines where trust is most at risk.
As mentioned above, the growth in extended warranties is not just steady but accelerating. Southern U.S. states held the largest market share in 2024, ahead of the North, East, and West.
According to Mordor Intelligence, in the global market North America held the largest share at 37.5% in 2024, underscoring the region’s outsized role in adoption driven heavily by U.S. consumer electronics, appliance, and retail penetration.
Why the momentum? It comes down to gaps in coverage and rising repair costs.
That gap matters. In 2023, Americans spent $8.3 billion on smartphone screen repairs, with the average fix costing around $302. Household appliances and electronics carry similar risks. For many consumers, adding a warranty at checkout feels less like an upsell and more like insurance against a future $300–$500 bill.
For example: Platforms like SureBright, AI-powered product protection services help merchants turn demand into revenue with attach rates above 20%, while reducing friction from fraud, shipping damage, and post-warranty failures.
Furniture retail runs on thin margins (2.4%) and faces high exposure, with 21% of oversized items arriving damaged and repairs averaging $287 per case. One California furniture retailer, selling through Amazon and showrooms, was going through three recurring issues:
Offering warranties changed the equation:

Extended warranty adoption in the U.S. is concentrated in a few categories and shaped by product value and demographics.
Consumer electronics lead the market. If we zoom in- the consumer electronics extended warranty market is expected to keep growing at a CAGR of 8.45% through 2032.
About 28% of U.S. consumers purchase extended warranties on electronics, the highest adoption rate outside of auto. This captures premium smartphones, laptops, appliances, and even some furniture products where a breakdown would mean a costly replacement.
Gender differences are modest. CivicScience surveys show women are slightly more likely to purchase coverage (55% of “always buyers”), while men are more likely to use them, filing claims when something breaks.
Generational signals are clear. Gen Z and Millennials are the most likely to buy coverage for phones, laptops, and tablets. Gen X is more inclined to add protection for appliances and home electronics, while seniors purchase fewer extended warranties overall, leaving them more vulnerable to costly repairs.
Product focus: where coverage concentrates
Coverage preferences:
Sources: Credence Research (2024)
Bottom line: Extended warranties are anchored in electronics and appliances, with younger buyers driving device coverage and Gen X extending it to household systems. Price remains the strongest adoption trigger, and coverage is increasingly split between standard plans for appliances and accidental plans for portable devices.
Warranty fraud rarely appears dramatic, but its impact is significant. According to a research collaboration between Appriss Retail and Deloitte, consumers returned $685 billion worth of items in 2024, 13.21% of total retail sales with $103 billion in losses tied directly to return and claims fraud.
While this figure captures multiple forms of abuse, warranty-related fraud is a consistent and measurable subset.
Warranty fraud typically hides within routine service activity: a return, a claim, or a replacement request. The most frequently observed tactics include:
Real cases show how warranty fraud works in practice:
The risk is most concentrated in portable, high-value electronics such as smartphones, laptops, and tablets. These products combine high resale demand with relatively low barriers to claim manipulation. Larger appliances and home systems are also targeted, though at lower levels due to higher logistics and replacement friction.

Porch piracy has moved from being an occasional inconvenience to a structural cost within U.S. commerce. With e-commerce sales climbing to $1.22 trillion in 2024 and projected to grow another 50% by 2029, the “last mile” is now the most visible weak point in the delivery chain.
The U.S. Postal Service Office of Inspector General (USPS OIG) estimates that 58 million packages were stolen in 2024, with losses ranging between $12 billion to $16 billion. What is striking is not only the volume, but also the value profile of the thefts.
The average stolen package is valued between $50 and $204, which means the total money lost adds up fast, even if the number of stolen packages goes up or down.
A longer view highlights this divergence between volume and value:
Sources: USPS OIG (RISC-WP-25-002, 2025); SafeWise Package Theft Reports (2022, 2023); Security.org Package Theft Report (2024); Consumer Reports (2021, cited in USPS OIG).

Key Insight: The number of stolen packages fluctuates by year and survey, but the financial burden is rising, driven by higher-value thefts. For merchants and carriers, the risk is less about frequency alone and more about value concentration in stolen goods.
Package theft is not spread evenly across the country. It is most common in large metropolitan areas, where thousands of deliveries happen every day and thieves can act without being noticed.
Top metro areas by package theft losses (2024)
Sources: SafeWise, cited in USPS OIG Report
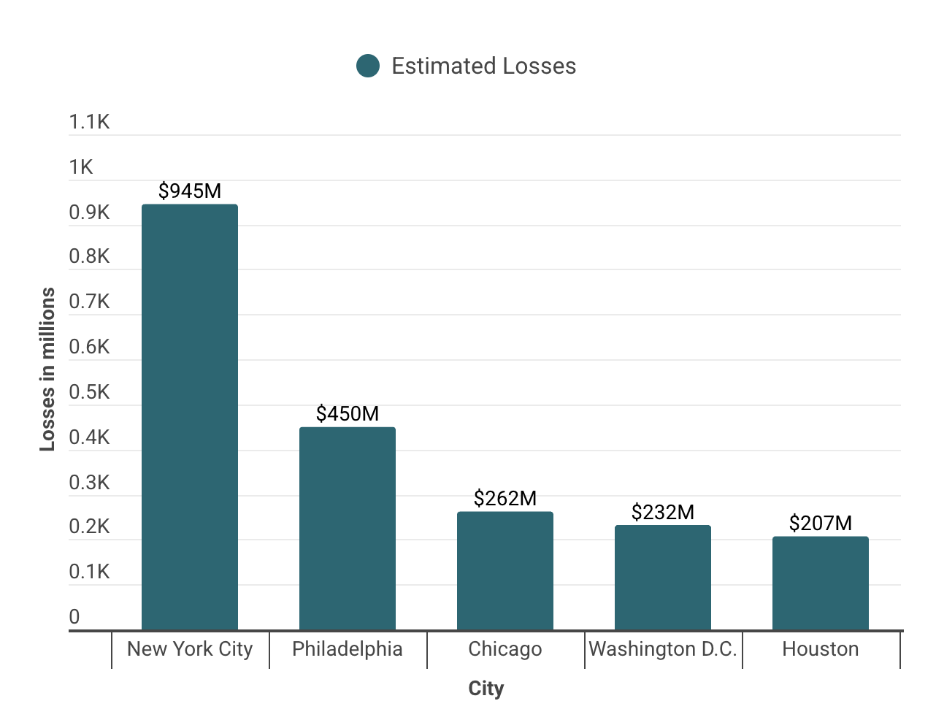
Bottom line: Porch piracy has become a multi-billion-dollar loss category, concentrated in major metros and increasingly skewed toward higher-value goods. For merchants and carriers, the challenge is not just securing volume but protecting the shipments where each incident carries outsized financial and reputational impact.
Porch piracy represents a persistent, year-round risk for merchants and carriers. However, incident volumes are not evenly distributed across the calendar. Theft activity consistently intensifies during peak e-commerce delivery cycles, when parcel density and consumer exposure are highest.
Police data from Los Angeles illustrate this seasonal effect: in December 2023, 436 package theft reports were filed, compared with a monthly average of 295 across January–November; a 48 percent increase. The surge aligns directly with holiday shipping volumes, which reached record highs during the same period.
Similar spikes occur around promotional sales events. Prime Day 2024 saw a 40 percent increase in thefts in the week following the event, reflecting the short-term concentration of deliveries.
Likewise, post–Black Friday and Cyber Monday weeks register higher theft reports and consumer concern. These are precisely the moments when delivery density and opportunistic theft overlap.
Porch piracy is like a hidden cost of e-commerce. It grows the most during the same shopping events that bring in the most sales. For merchants and carriers, this means risk planning can’t stay the same all year. Extra protection is needed during the busiest times, especially Q4 and big sales weeks.
The analysis of warranty adoption, warranty fraud, and porch piracy highlights a common theme: trust is both a growth driver and a point of vulnerability in modern commerce.
For merchants, these dynamics underscore the need to move beyond siloed risk management. Warranties, fraud prevention, and delivery protection are not separate functions, they are interconnected levers of customer trust and financial performance.